


Obtaining Morphometric Parameters
Key Steps
1. Image Conversion
In order to access the analysis tools in ImageJ, the images have to be converted to a specific type and format.
Under Image > Type , convert image type to 8-bit black and white.
Select the name of the image folder, and change the extension to tiff or tif.

Figure 2. Example of an 8-bit black and white, tiff image obtained through ImageJ.
2. Thresholding
In a 8-bit black and white (greyscale) image, there are 256 intensitiy graduations assigned to each pixel:
0 is black, 255 is white, and in between are all the shades of grey (Mcnaughton, 2010).
Thresholding (segmentation) is a technique that separates pixels based on the intensity assigned to them (ImageJ. 2015; Mcnaughton. 2010). It does so by selecting pixels that fall under a certain range of intensity, and removing all pixels not falling under this range.
Although this technique may sound easy because our eyes are extremely good at identifying and separating objects in an image despite how complex it may be, it seldom is that simple in practice. Most of the times, stray pixels that fall under the threshold range are shown as well even though they obviously should be excluded.
Learning this technique takes time and several trials (as shown in figure 3.), and a reasonable approach to ensure that thresholding is done accurately is to compare and contrast all of your thresholded images and select the image that is closest to your ideal selection.
In this study, the 'ideal selection' is to have all the red blood cells visible and to exclude other objects in the image. Under Image > Adjust > Threshold, select the default settings, and change the minimum and maximum intensities values until most of the red blood cells are clearly selected, and ensure, ideally, all of the other objects or background noise in the image are deleted.


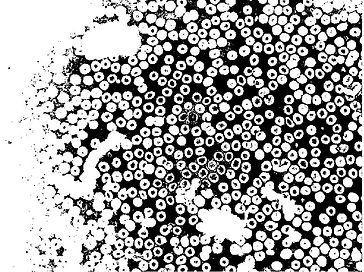
Figure 3. Examples of trial runs of thresholded images. The image at the top right corner was selected as the "ideal" thresholded image for further analysis. This was because, in comparison to all the other trial images, this image had the clearest identification of red blood cells throughout the image (most of the red blood cells are clearly outlined). However, some stains (larger particles) are remained in the image.
3. Watershed and Fill Holes
As shown in Figure 3 (top right image), although most of the cells are clearly outlined and distinguished for the naked eye, ImageJ does not recognise them as a filled particle because of the white space within the cell. Furthermore, many of the cells are clustered and recognised as one particle and not multiple cells.
Watershed is a technique that separates these clustered particles into individual particles if ImageJ has the potential of recognising them as multiple particles (IMSC, 2015). The successful completion of this technique highly depends on the correct intensity used in the thresholding process. If particles are not clearly outlined, ImageJ will further separate an individual cell into smaller fragments, if particles are too well defined, multiple cells will still remain one clustered particle.
The Fill Holes technique allows ImageJ to identify, shade, and make the inner components of cells part of the upcoming analysis, as show in figure 4. This is necessary in obtaining calculations on the area, and shape factors of red blood cells.
Under Process > Binary select Watershed. Then under Process > Binary select Fill holes.

Figure 4. Example of a image after the completion of Watershed and Fill Hole techniques.
3. Analysis of Measurements
Ensure the correct scale is chosen. This can be done with information on the original size of the image, and the magnification of the image (400). Under Analyse > Select Scale, input the actual width of the area in the image under Known Distance, and input the pixel width of the image (using the line tool) under Distance in Pixel.
The morphometric parameters that ImageJ is able to calculate are under Analyse > Set Measurements, select Area, Perimeter, Feret's Diameter, Shape Descriptors.
The analysis is carried out after selecting Analyse > Particles and choosing the most appropriate Size and Circularity range so that only red blood cells are analysed. Similar to the thresholding process, this technique requires multiple attempts; it is very difficult in identifying the ideal range that not only excludes all of the irrelevant particles, but also includes all of the relevant particles (as shown in figure 5).


Figure 5. 1) Top Image: Analysis attempt where Size and Circularity range was too wide, resulting in abundant irrelevant small and large particles to be carried on in the analysis. 2) Middle Image: Analysis attempt where Size and Circularity range was too narrow, resulting in a biased selection of red blood cells. 3) Final analysis attempt where Size and Circularity range was most "ideal".
Table 1. Examples of morphometric measurements on 17 particles (red blood cells) of the 529 total particles in one image.
